


WpECharts is the ultimate WordPress plugin for seamlessly integrating Apache ECharts, a powerful charting and visualization library, into your WordPress website. With WpECharts, you can insert stunning and interactive unlimited charts into Wordpress posts and pages via shortcodes.You can adjust the height and with of chart using shortcode attributes easily.
Currently this plugin supports only for following chart types
- Gauge basic
- Basic radar
- Basic candlestick
- Effect scatter chart
- Basic scatter
- Nightingale
- Doughnut
- Basic pie
- Multiple bars
- Stacked bar chart on polar
- Mixed line and bar
- Bar charts with negative values
- Stacked horizontal
- Stacked bar
- Horizontal bar
- Tangential polar
- Styled line
- Electricity distribution
- Basic line
- Stacked area
- Gradient stacked
- Waterfall chart
- Basic bar chart
- Stacked Line chart
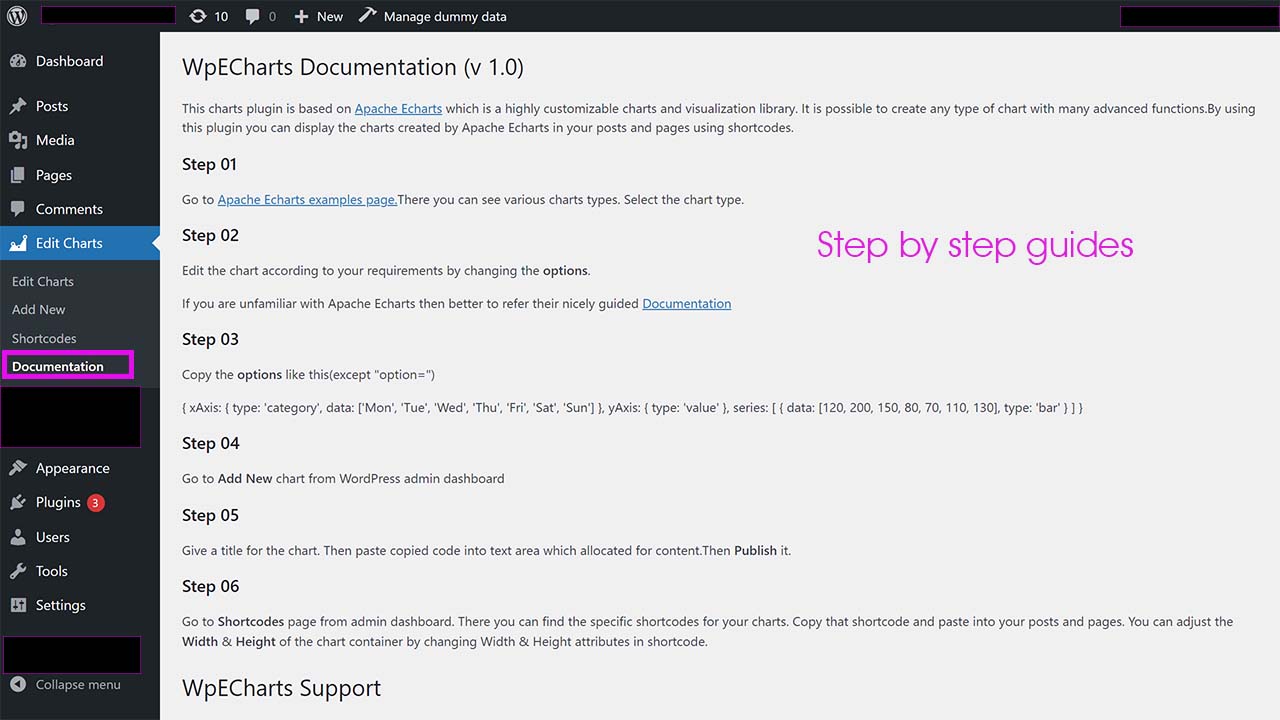
How to Use:
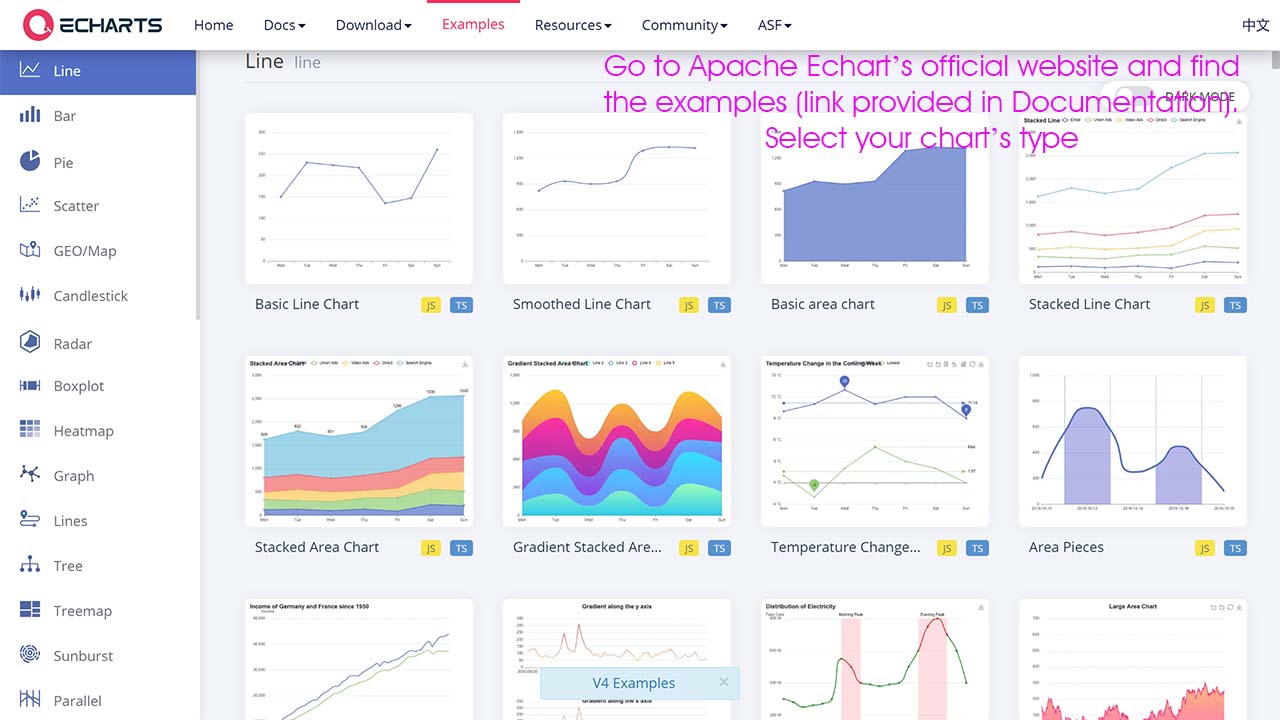
- Create a chart using Apache Echarts
- Install and activate the WpECharts plugin on your WordPress website.
- Access the admin dashboard and navigate to the WpECharts section.
- Add new chart
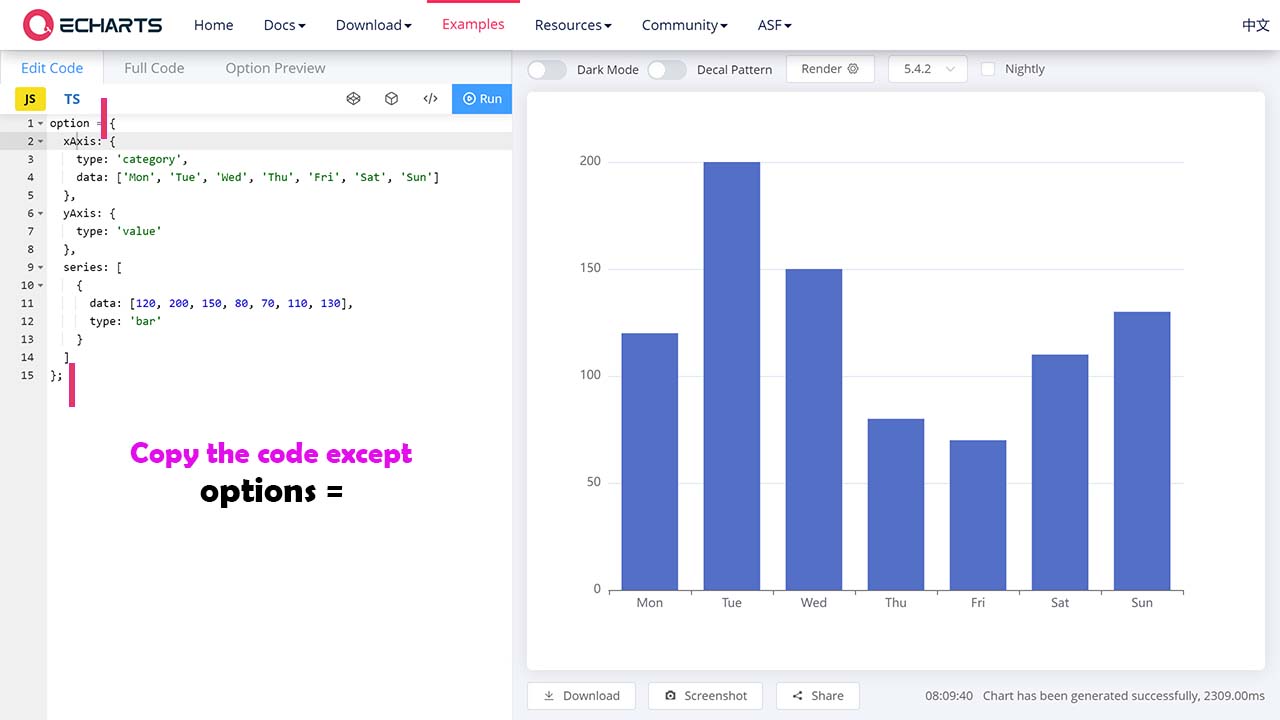
- Paste the options as we mentioned in documentation and save the chart.
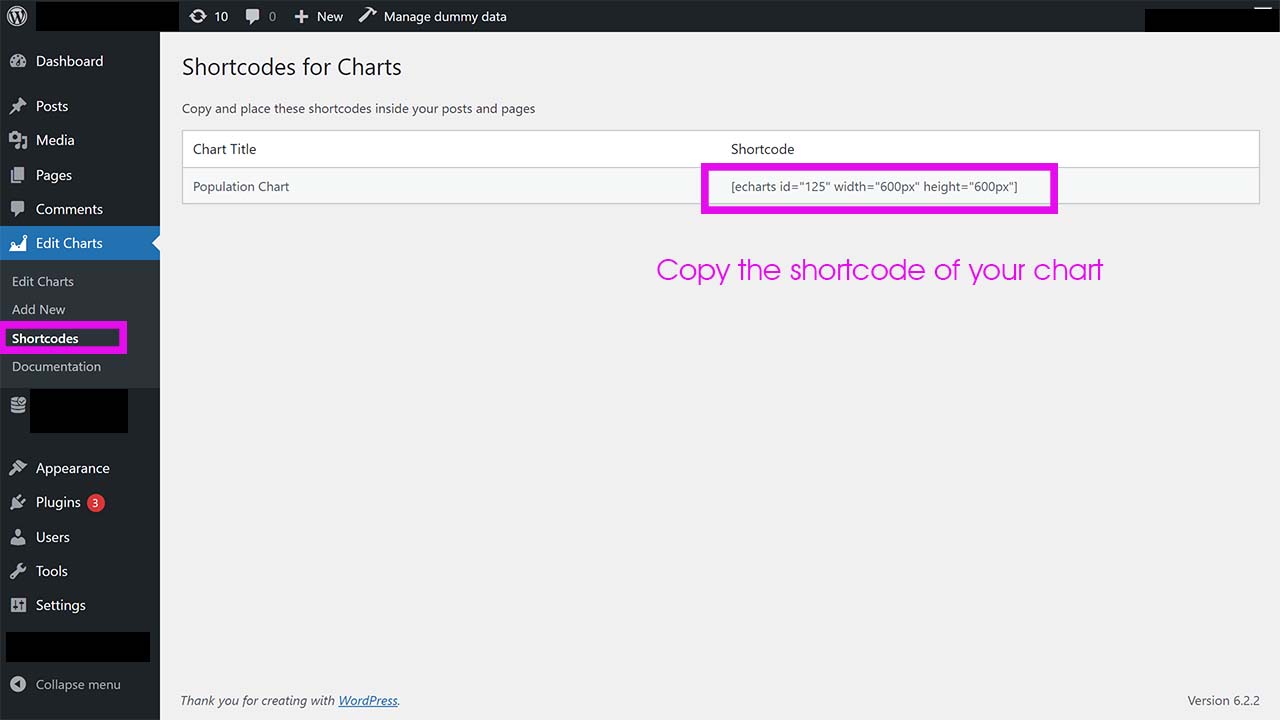
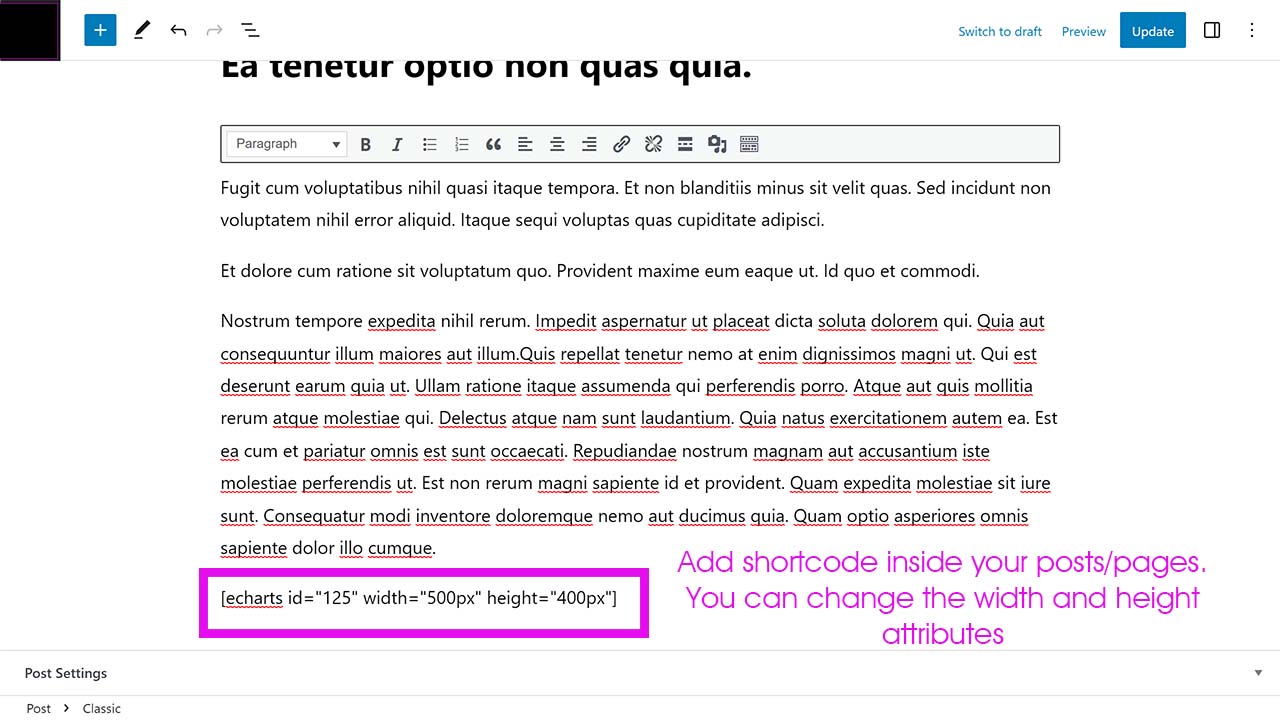
- Embed the chart in your WordPress posts or pages using the provided shortcode.
Unlock the Power of Data Visualization
WpECharts empowers you to leverage the full potential of Apache ECharts within your WordPress environment. Visualize your data in a meaningful way, enhance your content, and captivate your audience with eye-catching charts and graphs.
Get WpEcharts Now!
Don’t miss out on this opportunity to supercharge your WordPress website with the WpEcharts plugin. Purchase it from the Envato Market today and take your data visualization to the next level!